THE REF 2014 table of excellence
Click here to download full results
The REF 2014 results tables in full:
Overall ranking of institutions
Overall ranking of institutions including power market share
Ranking of institutions on impact
Institutions ranked by subject
Ranking of institutions on output
The proportion of UK research classed as world-leading has been given a major boost by the inclusion of impact in the 2014 research excellence framework.
But the new element of the exercise, the results of which were published on 18 December, has not had the revolutionary effect that some had predicted.
Some observers had thought that impact – which counts for 20 per cent of the final REF score – would lead to some post-1992 institutions breaking into the upper echelons of the rankings.
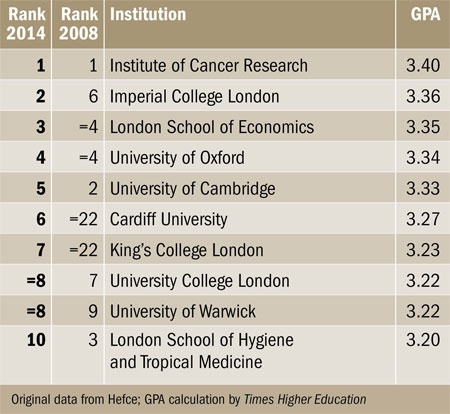
However, Times Higher Education’s ranking of institutions based on the grade point average of their results continues to be dominated by traditional research powers.
Of institutions that entered more than one unit of assessment, the Institute of Cancer Research retains the number one spot on GPA (see table above) that it held in the REF’s predecessor, the 2008 research assessment exercise – although it entered only two units of assessment. Imperial College London has risen from sixth to second, and the London School of Economics has climbed one place to third. The University of Oxford keeps its fourth place, but the University of Cambridge falls three places to fifth.
The highest ranking post-1992 institution is Cardiff Metropolitan University, in 41st place – although it entered only 35 researchers to three units of assessment. The next highest, the University of Brighton, is joint 58th, having entered 209 researchers to 10 units. Both institutions were aided by strong showings on impact. Brighton is the top-ranked post-1992 institution on impact GPA, in joint th. Cardiff Met is the next highest, in 50th.
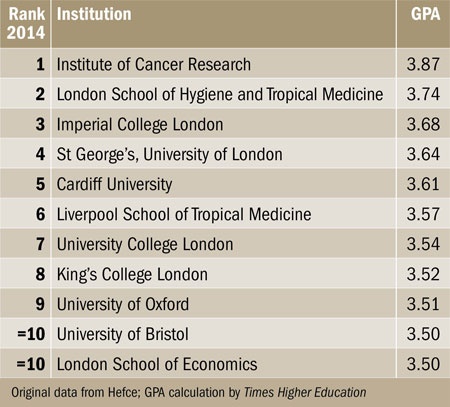
Predictably perhaps, medical institutions also score very highly on impact (see table below). The Institute of Cancer Research records the highest impact GPA, with 87 per cent of its submission rated 4* and the other 13 per cent 3*. Second for impact is the London School of Hygiene and Tropical Medicine; fourth is the medical school St George’s, University of London. The Liverpool School of Tropical Medicine is sixth.
REF 2014 top 10 by impact
Click here to download full results
It is also notable that some research-intensives have slipped in the overall table by underperforming on impact. The University of Warwick, which is joint eighth overall and sixth on outputs, is only 33rd for impact. Queen Mary University of London is joint 11th overall, and joint seventh on outputs, but only 30th on impact. The lowest ranking Russell Group institution on impact is the University of Exeter, in joint 43rd.
Ranked solely on quality of outputs (see table), the joint top institutions are the Institute of Cancer Research and the London School of Economics, followed by Oxford, then Cambridge and Imperial College London. On the same measure, there were notable performances by smaller research-intensives such as the University of Bath and the University of East Anglia, which are joint 10th. The lowest Russell Group member is Queen’s University Belfast, in joint 50th. It is also the lowest Russell Group member overall, in joint 42nd, one place below the highest post-1992 institution, Cardiff Met.
Among the top 30 on overall GPA, the biggest discrepancy between output and impact was shown by the London School of Hygiene and Tropical Medicine, which ranked 46 places lower on output.
Overall, impact has been scored much more highly than outputs. Of institutions submitting to more than one subpanel, 77 per cent had a higher GPA for impact than for outputs.
How submissions were rated: 2008 RAE and 2014 REF
Click image to enlarge
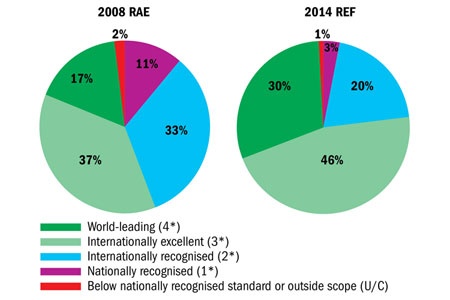
Across the nation as a whole, 44 per cent of impact submissions were rated 4*, compared with only 22 per cent of outputs. The overall national GPA has risen from 2.56 in 2008 to 3.01 in 2014, including a rise in the proportion of submissions rated 4* from 17 to 30 per cent (see charts above).
The “esteem” element of the 2008 RAE, which impact replaced, was not marked as highly as impact. But David Sweeney, director of research, education and knowledge exchange at the Higher Education Funding Council for England, which administers the REF, insisted that the overall rise in grades reflected higher output scores as well. He also noted that the national “spread of excellence” was similar to that found in 2008, with three-quarters of universities having at least 10 per cent of their work labelled world-leading.
“These are a strong set of results that capture the improvement in the quality of British research over the past six years,” he said.
Methodology
In the overall table of excellence, institutions are ranked according to the grade point average (GPA) of their overall quality profiles. This is made up of profiles for output (worth 65 per cent of the total), impact (20 per cent) and environment (15 per cent).
The data published today by the Higher Education Funding Council for England present the proportion of each institution’s submission, in each unit of assessment, that falls into each of five quality categories. For outputs, these are 4* (world-leading), 3* (internationally excellent), 2* (internationally recognised), 1* (nationally recognised) and unclassified. For impact, they are 4* (outstanding), 3* (very considerable), 2* (considerable), 1* (recognised but modest) and unclassified. Times Higher Education then aggregates these profiles into a single institutional quality profile based on the number of full-time equivalent staff submitted to each unit of assessment. This reflects the view that larger departments should count for more in calculating an institution’s overall quality.
Each institution’s overall quality profile is then converted into a grade point average by multiplying its percentage of 4* research by 4, its percentage of 3* research by 3, its percentage of 2* research by 2 and its percentage of 1* research by 1; the results are added together and divided by 100 to give a score between 0 and 4. Note that owing to the rounding of decimals, there may appear to be a small discrepancy between the overall quality profiles and the stated GPA.
Where universities have the same GPA, they are ranked according to their research power. This is calculated by multiplying the institution’s overall rounded GPA by the exact total number of full-time equivalent staff it submitted to the REF. This is an attempt to combine volume and quality to produce a ranking that gives a more accurate indication than GPA of the relative amount of quality-related research funding each institution is likely to receive. Further analysis of results based on research power and market share is available here.
The 2008 rank order is taken from Times Higher Education’s published rankings based on the 2008 research assessment exercise, which was the forerunner of the REF.
The impact table is constructed in a similar way but takes account solely of each institution’s quality profiles for impact. A similar table based solely on quality profiles for outputs is available online. The figure for number of UoAs entered counts multiple submissions separately.
The subject ratings rank each institutional submission to each of the 36 units of assessment based on the GPA of the institution’s overall quality profiles in that unit of assessment. Tables based solely on quality profiles for outouts and for impact are also produced alongside and are sorted by GPA score. Note that the rank order figures in the left-most column may not relate exactly to output and impact rankings. Figures for research power, as before, are calculated by multiplying GPAs by the number of academics submitted to the unit of assessment. Where a university submitted fewer than four people to a unit of assessment, Hefce has suppressed its quality profiles for impact and outputs, so it is not possible to calculate a GPA. This is indicated in the table by a dash.
As before, 2008 GPAs are taken from THE’s rankings based on the 2008 RAE. However, since many units of assessment have changed since then, figures are not always available. Where they are not, the column is marked “n/a”. The same marker is used to indicate where an institution did not submit to the relevant unit of assessment in 2008.
Where units of assessment have changed their names since 2008 but are still broadly comparable, we have included 2008’s score for comparison. These are indicated with an asterisk in the name of the UoA.
For each unit of assessment we also show the “national profile” provided by Hefce, which we use to calculate GPA and research power figures for the entire discipline. As above, the GPA calculation is weighted according to the number of people submitted by each university.
Where the same institution made multiple submissions to the same unit of assessment, the various submissions are marked with different letters (eg, “University of Poppleton A”). Where universities have made joint submissions, they are listed on separate lines. The one with the higher research power is listed first.
The Higher Education Statistics Agency’s data on the number of staff eligible to be submitted, published today, was not available in time for Times Higher Education’s press deadline. Hence, this information is not taken into account in these tables.
Data analysis was undertaken by TES Global Information. Special thanks to Almut Sprigade and Ilan Lazarus. The official REF data are at www.ref.ac.uk.

Register to continue
Why register?
- Registration is free and only takes a moment
- Once registered, you can read 3 articles a month
- Sign up for our newsletter
Subscribe
Or subscribe for unlimited access to:
- Unlimited access to news, views, insights & reviews
- Digital editions
- Digital access to THE’s university and college rankings analysis
Already registered or a current subscriber? Login


