Source: British Library Board
Click image to enlarge
While easily shared infographics are all the rage in the era of social media, the practice of turning numbers into pictures to make them accessible to all goes back through the ages.
Beautiful Science: Picturing Data, Inspiring Insight is an exhibition of data pictures dating from hundreds of years ago to the present day.
This gallery features some of the highlights from the event, which is being held at the British Library in London, and runs until 26 May 2014.
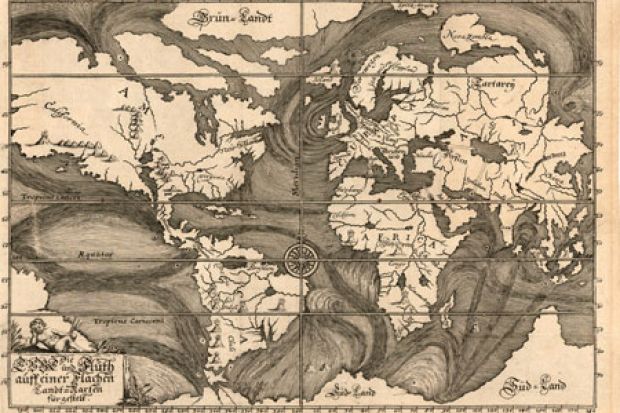
Early Ocean Currents
The unusual map pictured above is from 1685, and illustrates ocean currents as understood at the time based on the observations of explorers and mariners.
Though necessarily conjectural in many ways, it highlights the remarkable effort made by early cartographers to make sense of an accumulation of data from such reports without the visualisation tools we have today.
Air Currents over the British Isles
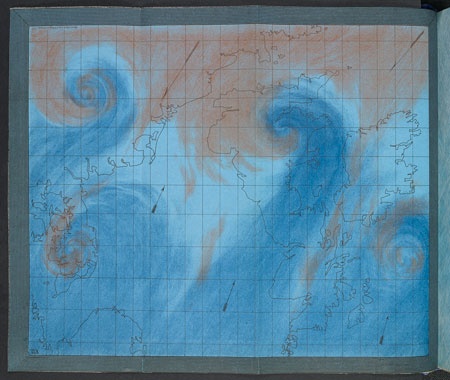
Robert FitzRoy, best known as the captain of HMS Beagle aboard which Charles Darwin sailed as a naturalist, is also widely considered to be the grandfather of the modern weather service.
This illustration shows how storms and cyclones develop on the border between warm tropical and cold polar air masses and looks remarkably like a modern satellite image.
Circles of Life
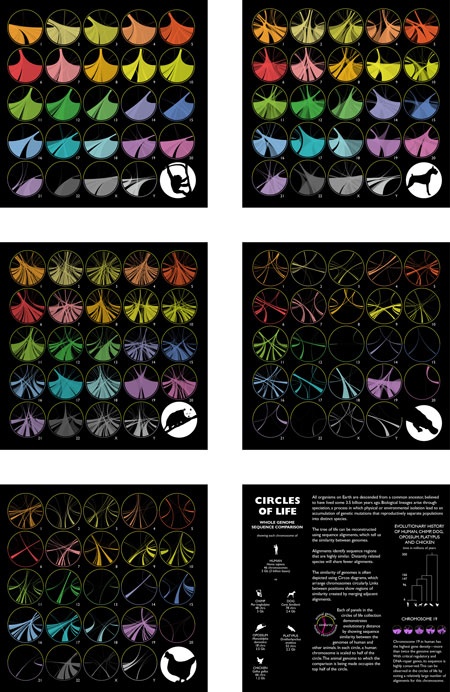
Specially commissioned for the Beautiful Science exhibition, these striking “Circos” diagrams picture the genetic similarities between humans and five other animals: chimpanzee, dog, opossum, platypus and chicken.
Great Chain of Being
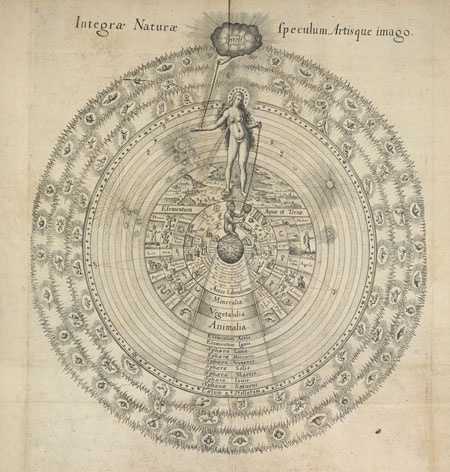
The “Great Chain of Being” is an ancient Greek concept that classifies life on earth into a hierarchical order with respect to the rest of the universe.
In this diagram, the oldest exhibit in the exhibition, the chain starts with Sophia, goddess of wisdom, and extends downwards to animals, plants and minerals.
Temperature and Mortality of London
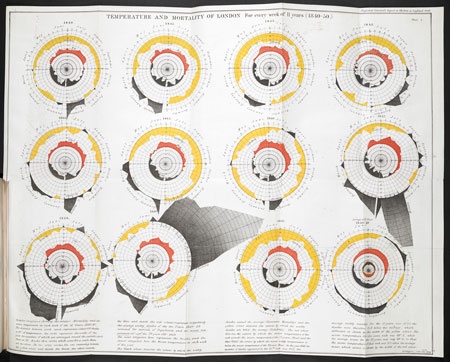
In these diagrams, epidemiologist and statistician William Farr plotted cycles of temperature and cholera deaths for 1840-50.
He notes that the circular form and colours make “the diagram represent the facts in a striking manner to the eye”.
At the time, Farr believed that cholera, now known to be caused by water-borne bacteria, was spread by miasma or “bad air”, sourced from evaporation of the Thames.
Although this hypothesis was incorrect, Farr left an important legacy.
He set up the first national system for collecting statistics, advocated a data-driven approach to public health, and utilised innovative graphic methods to communicate that data.
Avian Tree of Life
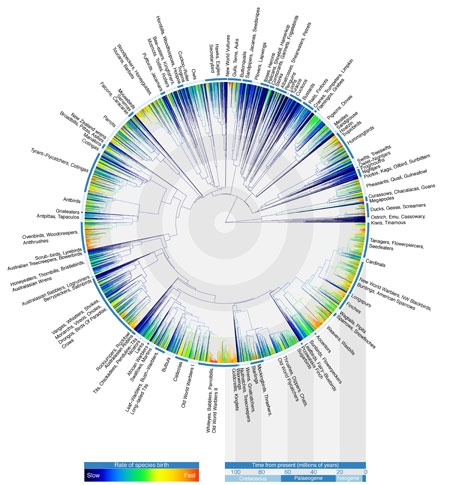
This diagram depicts evolutionary relationships of all 9,993 living species of birds, illustrating when individual species diverged.
Although modern birds first evolved some 145 to 66 million years ago, this diagram shows that they began to diversify exceptionally rapidly about 50 million years ago.
This is particularly apparent for the songbirds, waterfowl, gulls and woodpeckers.
Bills of Mortality
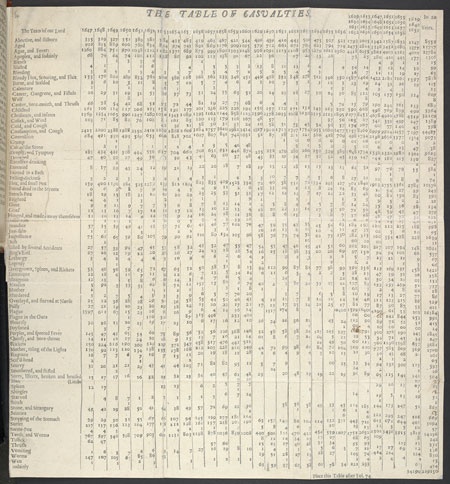
From 1603, London parish clerks began to collect health-related population data in order to monitor plague deaths, publishing the London Bills of Mortality on a weekly basis.
John Graunt amalgamated 50 years of information from the bills in Natural and Political Observations on the Bills of Mortality (1662), producing the first known tables of public health data.
View the latest Times Higher Education infographics

Register to continue
Why register?
- Registration is free and only takes a moment
- Once registered, you can read 3 articles a month
- Sign up for our newsletter
Subscribe
Or subscribe for unlimited access to:
- Unlimited access to news, views, insights & reviews
- Digital editions
- Digital access to THE’s university and college rankings analysis
Already registered or a current subscriber? Login